Waterfall — Spectral Decay
#waterfall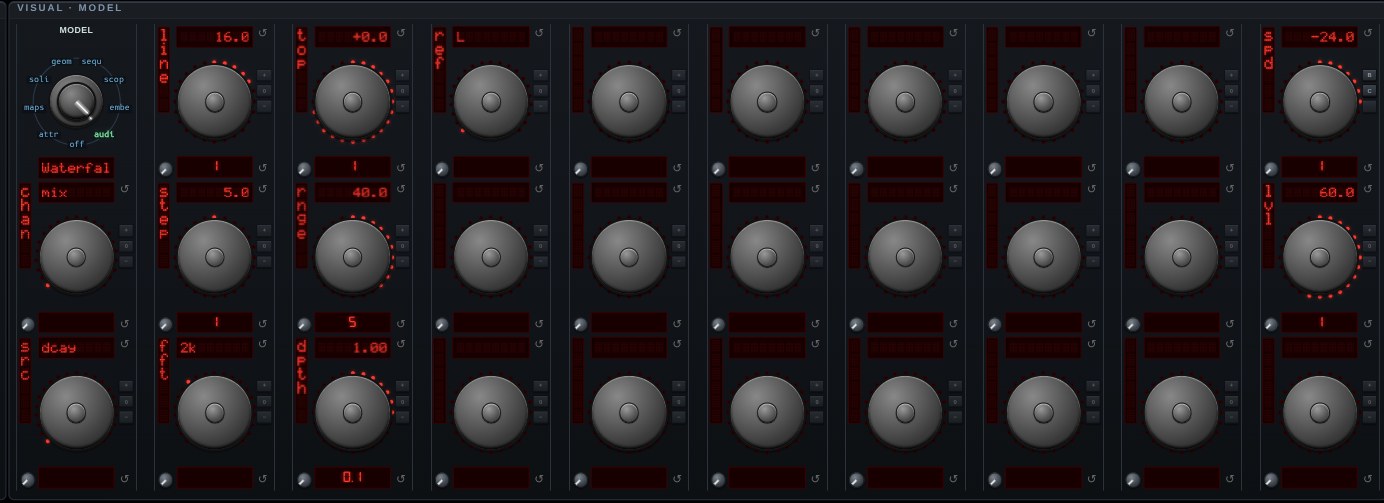
Waterfall — Cumulative Spectral Decay. The measurement a loudspeaker is characterized by, and the one display here that could only exist in this app: every other analyzer draws its own flat panel and this is a genuine 3-D surface, so it rides the same pipeline the attractors do and drags, rotates, zooms and takes the gradient like any other model. Frequency runs left to right, logarithmically, because hearing is organized in ratios; level runs up; and TIME runs into the screen. Each line is the spectrum of what is left of the impulse response from a moment onwards, so a flat loudspeaker's surface falls away evenly and a RESONANCE is a ridge running back into the screen at one frequency. That is what this is for: a frequency response cannot tell a resonance from a broad lift, because they are identical in magnitude and nothing alike in time.
Feed it a generator's log sweep (its swp wave), with the sweep in one channel as the reference and what came back in the other. The impulse response is recovered by deconvolution and the surface rebuilt each time a sweep pass completes — so unlike every other audio mode the picture HOLDS STILL between passes, which is what makes it something to rotate and look at rather than something to freeze first.
LINE is how many slices the surface has and STEP how far apart they are in milliseconds, so the two are how deep it reaches in TIME: sixteen at 5 ms is the 80 ms a loudspeaker's resonances live in, thirty-two at 40 ms the 1.3 seconds a bar of music takes. FFT is the transform each slice is taken through, and it is a genuine trade — 1k resolves time best and the bass worst, 8k the other way, and a window longer than STEP means consecutive slices see the same audio. TOP and RNGE place the level scale in dBFS as they do on the RTA. DPTH is how far back the surface reaches on screen, which is geometry rather than time. CHAN is the channel the live surface analyses; REF is which channel the decay surface calls the reference, because that one needs both. LINE, STEP and FFT follow the SRC switch to what each surface wants, and stop following once you turn one.
Turn the Colors SOURCE ring to Y: it colors by LEVEL across exactly the decibels TOP and RNGE show, which is how every published CSD plot is colored. Z and trail color by age, X repeats the frequency axis, and AUDIO is one flat tint here.
A sweep takes four seconds to cross the band, so the measurement needs a whole pass: a third of one is 20 Hz to 200 Hz and recovers an impulse five milliseconds wide.
SRC PICKS WHICH SURFACE. DCAY is the decay above, which is a measurement and needs the sweep. LIVE is the other thing the word waterfall means: successive spectra of whatever is playing, stacked into the screen as they age, so the depth axis stops being time-since-the-impulse and becomes time-ago. Live is the one for music — a note is a ridge that rises at the front and travels back as it decays — and decay is the one for a measurement rig.
RT60 is the room's reverberation time from the same impulse, by Schroeder backward integration as T20 between -5 and -25 dB: the one number the surface is far too shallow to show. Blank on the live surface and blank through a wire, neither of which has a decay to measure.
Open Waterfall — Spectral Decay in chaosrack →It opens running, on the model selector, with its own knobs. Rotate it by dragging, zoom with the wheel, and turn the parameters to see what the figure does when the system changes.