Spectrogram
#spectrogram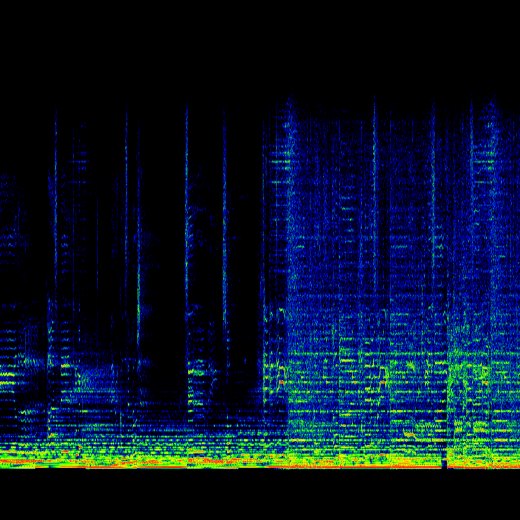
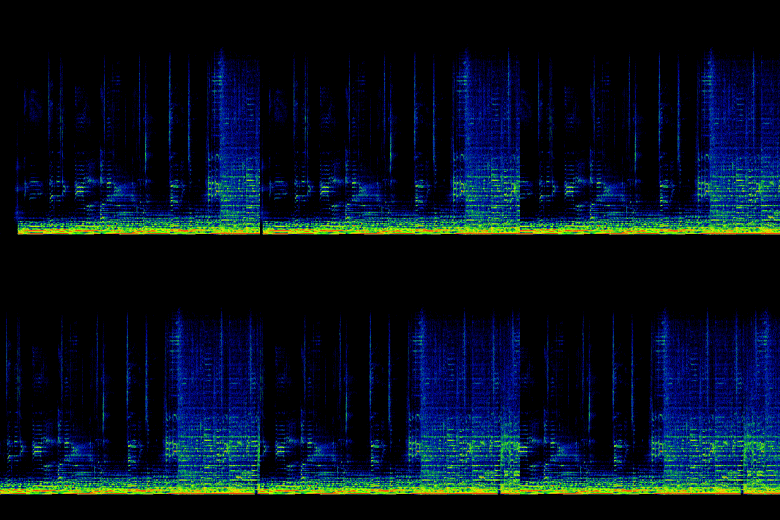
Spectrogram — a scrolling short-time Fourier transform of the live audio: frequency up the plane, time scrolling right to left, magnitude as color. It is a display inspired by Vanya Sergeev's audioprism, written in Go (github.com/0magnet/audioprism-go) and drawn here as a texture on a plane in the same 3-D pipeline as every other model, so it rotates and zooms like one — and the same texture can be painted onto other geometry with the skin switch. The Spectrogram module exposes the whole chain: transform size, overlap, window function, magnitude scale and limits, and color scheme.
Open Spectrogram in chaosrack →It opens running, on the model selector, with its own knobs. Rotate it by dragging, zoom with the wheel, and turn the parameters to see what the figure does when the system changes.